Using
Python with seismic data
Lesson 5: Packages and Constants
Packages contain functions which you can import into your code once you have
installed them.
In Thonny, use Tools | Manage Packages to
install folium, a mapping package.
You can find the Folium Quick Start Guide here: Quickstart - Folium 0.12.1 documentation (python-visualization.github.io) and it's worth working through their examples slowly.
Create a
map centered on Truro
To create a map centered on Truro, with a marker for Truro School, run the following code in Thonny:
import folium
map=folium.Map(location=[50.2607, -5.042], zoom_start=18, tiles='openstreetmap')
folium.Marker([50.26111, -5.04331], popup="Truro School", tooltip="Click me!").add_to(map)
map.save("truro-map.html")
The map will be saved as an html file in the same folder as
the script. You can open it in a web browser by double clicking on the file.
After each change to the map made through your code, refresh the map in your
web browser using f5 or the refresh icon.
It is possible to choose various maps, including: 'OpenStreetMap', 'Stamen Terrain' or 'Stamen Toner'. Try the different map tiles and starting zoom levels, from 1 - zoomed right out, to 18 - zoomed close in.
Find your location
Folium has a feature called LatLngPopup which will give the lat-long of a location you click. Use this to find somewhere of interest, for example your home, note the latitude and longitude and then recentre the map there.
map.add_child(folium.LatLngPopup())
Add a
marker
Glyphicons
As well as folium markers, it is possible to use icons, like this water droplet, called 'tint' from the built-in Glyphicons: Components - Bootstrap (getbootstrap.com).
folium.Marker([50.255,
-5.043], popup="<b>Truro River</b>", tooltip="Click
me!", icon=folium.Icon(color="blue",
icon="tint")).add_to(map).
Font
Awesome
Or this ship from the Font Awesome icons: https://fontawesome.com/v4/icons/, by adding prefix="fa" like this:
folium.Marker([50.255,
-5.043], popup="<b>Truro
River</b>", tooltip="Click me!", icon=folium.Icon(color='blue',
prefix='fa',icon='ship')).add_to(map).
Experiment
Try experimenting with different colours, icons, maps and zoom levels. The popups use html formatting, so for example, you can include a link to a web site using <a href="URL">Website Name</a>.
import folium
map=folium.Map(location=[50.259998,
-5.051000], zoom_start=14, tiles='openstreetmap')
folium.Marker([50.255,
-5.043], popup="<a
href='https://www.falriver.co.uk/ferries/enterprise-boats'>Enterprise
boats</a>", tooltip="Click me!", icon=folium.Icon(color='blue',
prefix='fa',icon='ship')).add_to(map).
map.save("truro-map.html")
Formatted popups in html
More complex html is possible within a popup, for example, this small web page with a title and two clickable links, defined within a triple-quoted string. Try experimenting.
popup_html
= '''
<html>
<head></head>
<body>
<h2>Truro
River</h2>
<p><a
href='https://www.falriver.co.uk/ferries/enterprise-boats'>Enterprise
boats</a></p>
<p><a
href='https://thealverton.co.uk/news/hidden-truro-sunny-corner/'>Sunny
Corner</a></p>
</body>
</html>
'''
folium.Marker([50.255,
-5.043], popup=popup_html, tooltip="Click
me!", icon=folium.Icon(color='blue',
prefix='fa',icon='ship')).add_to(map)
Mapping seismic data
The following script creates a map showing an epicentre and a seismometer, the map is saved in a file called earthquakemap.html, in the same folder where you saved your code. Double-click on the map to view it in your internet browser, you can pan and zoom to explore the map.
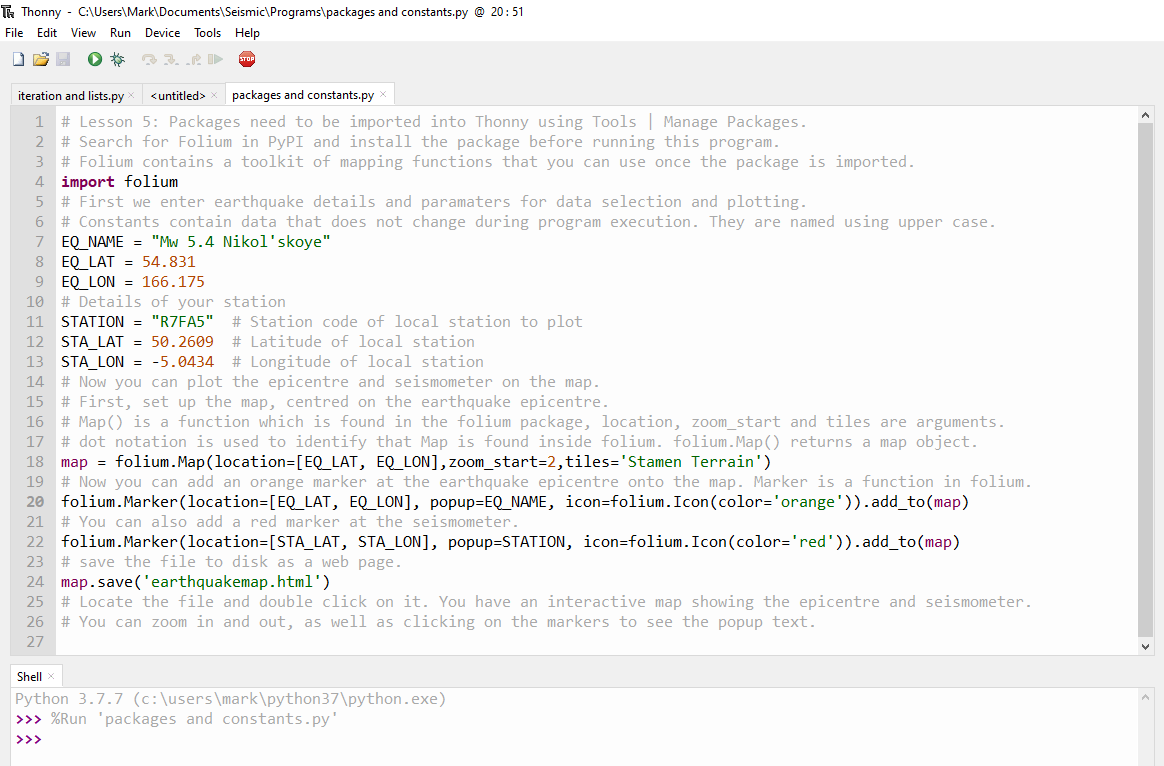
import folium
EQ_NAME = "Mw 5.4 Nikol'skoye"
EQ_LAT = 54.831
EQ_LON = 166.175
STATION = "R7FA5"
STA_LAT = 50.2609
STA_LON = -5.0434
map = folium.Map(location=[EQ_LAT,
EQ_LON],zoom_start=2,tiles='Stamen Terrain')
folium.Marker(location=[EQ_LAT,
EQ_LON], popup=EQ_NAME, icon=folium.Icon(color='orange')).add_to(map)
folium.Marker(location=[STA_LAT,
STA_LON], popup=STATION, icon=folium.Icon(color='red')).add_to(map)
map.save('earthquakemap.html')
Explanation of this code
Packages
Packages must be imported before they can be used.
Functions can be called using dot notation, e.g. after importing folium, a new
map object can be created like this:
map = folium.Map(location=[EQ_LAT,
EQ_LON], zoom_start=2, tiles='Stamen Terrain')
This line calls a function which produces a zoomed out terrain basemap centred on the epicentre.
Constants
Constants are names used to store data that does not
change during code execution. By convention constants are shown in upper case
in Python and generally they are defined at the start of the code e.g. EQ_LAT
and EQ_LON, the latitude and longitude of the earthquake epicentre.
Folium
Folium contains lots of mapping functions as you can
see in the Quickstart guide: http://python-visualization.github.io/folium/quickstart.html.
The next script uses a for loop to plot seismometers from the Cornwall school
network, the seismometer names are held in a list, showing the seismometer
code, location, latitude (northing) and longitude (easting). Once the code has
run, find the html file in the same folder as your script, double click to open
in a browser.
The stations
STATIONS = [
['RB30C','Falmouth',50.149,-5.095],
['RB5E8','Penzance',50.118,-5.539],
['RD93E','Redruth',50.234,-5.238],
['R82BD','Richard
Lander',50.26,-5.103],
['R7FA5','Truro
School',50.261,-5.043],
['R0353','Penair',50.267,-5.03],
['R9FEE','Truro
High',50.257,-5.057] ]


Mapping earthquake epicentres
The USGS publish information about the latest earthquakes
they have detected, including a map interface, searchable database and various
automatic feeds.
The map interface can be found here: https://earthquake.usgs.gov/earthquakes/map/.
Other organisations, such as the EMSC and BGS publish local earthquake information for Europe,
the Mediterranean and the British Isles which may not appear on the USGS lists.
Here is some earthquake data from Japan, published by the USGS. The list shows five earthquakes, with the magnitude, date, latitude (northing), longitude (easting) and depth in kilometers.
earthquakes = [
[5.4,
"04/08/2021", 36.1662, 141.7545, 19.20],
[4.8,
"11/04/2020", 36.2140, 140.0096, 58.13],
[5.1,
"06/08/2020", 37.3899, 138.7273, 177.42],
[6.1,
"29/09/2021", 38.8721, 135.4642, 367.70],
[4.7,
"30/12/2018", 38.3792, 133.8402, 431.81]
]

Here is the resulting map, the colour indicates the depth of
the focus, from red (0-100 km), through orange (100-200 km), yellow (200-300
km), green (300-400 km) to blue (400-500 km).
The earthquakes get deeper towards the north west. The size of the circle
markers in pixels is proportional to the earthquake magnitude.
The map produced by Folium is interactive and you can click on a version of it
below.

Other vector layers are, Polyline, Polygon, Rectangle, Circle, and CircleMarker, details of which can be found here: http://python-visualization.github.io/folium/modules.html#module-folium.vector_layers
Exercises
1) Create a map centred on Portland, Orgeon
as follows:
import folium
m=folium.Map(location=[45.5236,
-122.6750], zoom_start=13)
Saved the map using:
m.save("map.html")
Change the latitude and longitude to a city of your choice,
you can probably get coordinates from Wikipedia. Fine-tune the latitude and
longitude to centre on something of interest to you.
Near the equator, each degree of latitude and longitude is approximately 111
km, so 0.001 degrees is roughly 111 metres.
Experiment with the zoom to determine the maximum possible
zoom and hopefully marvel at the detailed information you can see.
Once you have run the code, open the web page in your browser. Each time you
update and run the code, use refresh in your browser to see the updated map.
2) Create a map centred on Mount St Helens volcano, with a marker for Spirit Lake.
import folium
m = folium.Map(location=[46.1912,
-122.1944], zoom_start=12, tiles="Stamen
Terrain")
folium.Marker([46.27,
-122.145], popup="<i>Spirit Lake</i>", tooltip="Click me!").add_to(m)
m.save("map.html")
Add markers for the lava dome at 46.201, -122.189 and Johnston Ridge
Observatory, near the location where volcanologist David A Johnston was killed
during the eruption at 46.275554, -122.21606.
This map uses Stamen Terrain, which is not the default map tile.
3) Experiment with other html tags in the popups associated with the markers, for example:
... popup="<b><a
href='https://www.fs.usda.gov/visit/destination/johnston-ridge-observatory'
target='_blank'>Johnston Ridge Observatory</a></b>" ...
This code fragment displays the popup text in bold and adds a hyperlink to the Johnson Ridge Observatory, which opens as a new page when clicked.
4) Change the markers using different colours and icons for example, to change
the lava dome to a red marker with a cloud, use:
folium.Marker([46.201,
-122.189], popup="<b>lava dome</b>", tooltip=tooltip,
icon=folium.Icon(color="red",
icon="cloud")).add_to(m).
The full list of glyphicon icons
is here: https://getbootstrap.com/docs/3.3/components/.
Alternatively, use the Font Awesome icons from here: https://fontawesome.com/v4/icons/,
by adding prefix="fa" like this:
folium.Marker([46.27,
-122.145], popup="<i>Spirit Lake</i>", tooltip=tooltip, icon=folium.Icon(color='blue', prefix='fa',icon='ship')).add_to(m).
5) Change the tiles, experiment with the
default OpenStreetMap, also Stamen Terrain, Stamen Toner, Stamen Water Color, cartodbpositron and cartodbdark_matter tiles.
The code to change the map tiles is:
m = folium.Map(location=[46.1912,
-122.1944], zoom_start=12, tiles="Stamen
Terrain")
6) Before the eruption, authorities imposed a 5 mile
exclusion zone around the volcano. Add a circle to the map to show a 5 mile (8
km) exclusion zone.
This did not include the location of the ridge where the Johnston Ridge
Observatory is now located, near to where David Johnston died:
folium.Circle(location=[46.201,
-122.189], radius=8000, color='crimson', fill=True,).add_to(m).
See https://darigak.medium.com/your-guide-to-folium-markers-b9324fc7d65d for another helpful tutorial.
Links
The original tweet:
https://twitter.com/wmvanstone/status/1252307057153388548
The code on Github: https://github.com/wmvanstone/LearnPythonForObspy
The obspy tutorial: https://docs.obspy.org/tutorial/
The folium quick start guide: http://python-visualization.github.io/folium/quickstart.html.
Another folium tutorial: https://darigak.medium.com/your-guide-to-folium-markers-b9324fc7d65d
Lesson 4: python04.htm
Lesson 6: python06.htm
Links: Links
Home: Index